that offers option traders a unique opportunity not available to
individuals who only trade underlying securities. Specifically, a long
straddle affords a trader the opportunity to make money regardless of
whether the underlying security advances or declines in price. The
tradeoff is that the long straddle will lose money if the underlying
security remains close to the price it was at when the trade was
initiated. However, the trader can position the trade to give the stock
enough time to make a meaningful move. (For more on long straddles, see
and the same expiration month. A call option gains value as the
underlying security rises in price and a put option gains value as the
underlying security declines in price. However, both options have
limited risk. Therefore, the goal is to have the underlying security
either:
. (To keep reading about straddles, see
One of the two options must advance
more in price than the other option declines in price. In addition, the
maximum profit potential on a long straddle is unlimited. As long as the
stock keeps moving further and further in one direction, the long
straddle can continue to accumulate greater and greater profits.
Option
prices are comprised of
intrinsic value and
time premium. Intrinsic value is the amount that an option is
in-the-money. The remainder of the price of an in-the-money option and the entire price of an
out-of-the-money option is comprised of
time
premium. Therefore, the risk in buying a long straddle is that the
underlying security will not make a meaningful move in either direction
and that both the options will lose time premium as a result of time
decay. The maximum risk for a long straddle will only be realized if the
underlying security closes exactly at the strike price for the options.
Looking for the Next Big MoveIf you look at a price chart of virtually any security, you will find periods of price
consolidation
followed by price trends in one direction or the other. This trending
period is then followed by another consolidation and so forth. If you
look at enough charts, you will also notice that some securities are
inherently more volatile than others. Because you need some type of
meaningful price movement in order to make money on a long straddle, it
then makes sense to consider buying a long straddle on a typically
volatile security
after it experiences a price consolidation.
A
consolidation phase can often be quite subjective, but in the end the
idea is simply to identify a period of time during which the stock in
question has "gone nowhere". In addition, the more "tightly wound" the
price action is during the consolidation - or, the longer and more
narrow the trading range - the more likely the eventual
breakout
will involve a meaningful price movement. Some traders use various
indicators to measure and identify consolidation, but it is possible to
identify significant trading ranges simply by inspecting the price
action for a given security on a price chart.
The first step is to identify a stock that has a history of making significant movements in price. Stodgy old
blue chip
stocks or utility stocks typically are not the best candidates for the
long straddle strategy because they simply do not move significantly
enough in price to generate a profit. What you really want are the
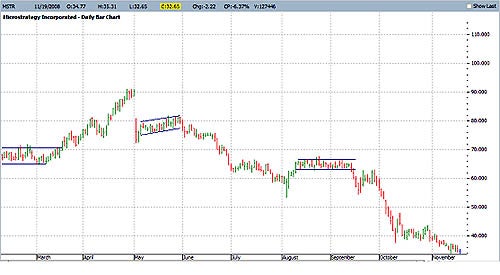
high fliers that routinely make significantly large percentage price movements. In 2009, one such stock is Microstrategy (Nasdaq:
MSTR),
which appears in Figure 1 below. As you can see from a simple visual
inspection of this chart, MSTR has a tendency to wind into a tight
trading range and to then break out of that range with a large move.
 |
| Figure 1: Microstrategy (MSTR |
| Source: ProfitSource |
Buying a Long Straddle Following ConsolidationOnce
a stock establishes a trading range over a 10-day period at least, the
thing to watch for is a breakout in either direction.
Many traders will
attempt to play the breakout in the direction of that initial breakout:
they will get bullish if the stock moves to the upside and bearish if it
breaks to the downside. However, breakouts often have a high failure
rate and whipsaws
can leave those initial buyers or short sellers with a quick loss. This
is why a long straddle can be quite useful in this situation.
For example, if the stock breaks out to the upside and keeps going, a
long straddle will make money. Likewise, if the upside breakout fails
and the stock turns and runs to the downside, the long straddle can make
money in that case also. In Figure 1, there are three consolidation
periods marked for MSTR. Each consolidation was followed by a
significant move in price. If you look at the second set of parallel
lines, which occurred during the month of May, you can see that the
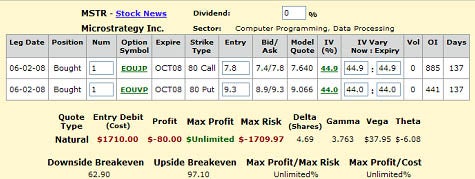
stock broke to the downside on June 2. In Figure 2, you see a long
straddle trade that could have been entered using options on MSTR.
In
this example, the trade involved buying one October 80 strike price
call option for $7.80 and simultaneously buying the October 80 strike
price put option for $9.30. Thus, this trade costs $1,710 to enter
[($7.80 + $9.30) * 100 Shares per options contract].
 |
| Figure 2: Long Straddle using options on MSTR |
| Source: Optionetics Platinum |
The Particulars of the Long StraddleWhen you enter a long straddle, there are always three certainties:
- You have unlimited profit potential.
- Your risk is limited to the amount you pay to purchase the call and put options.
- Your breakeven points are equal to the amount you paid added to and subtracted from the strike price of the options purchased.
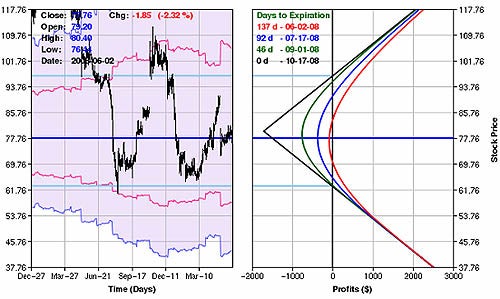
You can see these factors reflected in the risk curves that appear in
Figure 3, below. On the left-hand side is the price chart for MSTR. On
the right-hand side are the risk curves that depict the expected profit
or loss at any given stock price as time goes by. You can see in these
risk curves that the higher or lower the stock moves, the greater the
profit. You can also see that the maximum loss is $1,710. This will only
occur if MSTR is trading exactly at $80 at the time of option
expiration. You can also view the effect of
time decay,
or the process by which an option loses whatever time premium was built
into its price as expiration approaches. This is reflected in the fact
that the risk curves shift to the left (reflecting either a smaller
profit or a larger loss) as time goes by.
Lastly, if it is held until option expiration, then you can see that the
breakeven points
for this trade will be 62.90 and 97.10. These points are arrived at by
adding and subtracting the amount paid to purchase the straddle (17.10
points) to the strike price of 80.
 |
| Figure 3: Risk Curves for MSTR Long Straddle |
| Source: Optionetics Platinum |
Managing the TradePrior to entering a long straddle, it is essential to determine what would cause you to exit the trade
with a profit or with a loss. Regarding risk control, some traders will set a percentage of the amount paid as a
stop-loss
point. Another possibility is to set a time limit. For example, a
trader might decide to risk, say, 50% of the premium paid to enter the
trade. For the MSTR example, this works out to about $850. As you can
see above in Figure 3, if this trade was held until September 1 and the
stock was about unchanged, then this trade would show a loss in the
$800+ range.
In regards to profit-taking, different traders use a
variety of different methods, but one of the simplest and most useful
is a simple profit target. For example, a trader might decide to exit
the position if a profit of a given amount or percentage is achieved.
This comes down to personal preference and also depends on one's
expectations for the underlying stock. However, it is not uncommon for a
trader to target a 20-50% return. For the MSTR long straddle example, a
profit target of 20% would mean that one would look to take a profit
once the profit on the trade exceeds $342 ($1,710 * 0.2).
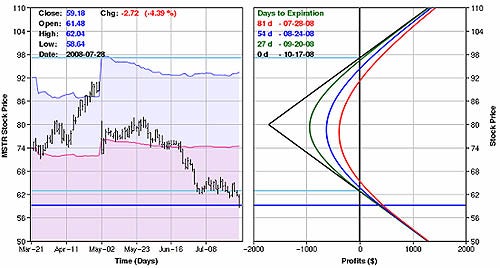
It
took close to two months, but on July 28, MSTR finally fell far enough
to generate an open profit of $430. The buyer of this long straddle
could have exited the trade at this point and garnered a profit of 25%
in just two months' time. The risk curves in Figure 4 are updated to
reflect the change in the stock and the value of the long straddle
position as of July 28.
 |
| Figure 4: MSTR stock drops, long straddle becomes profitable |
| Source: Optionetics Platinum |


No comments:
Post a Comment